Tel:742-138-8342
Mail:sales@asimicrofluidizer.com

Differences in intracellular protein expression among different mRNA‑LNPs (Reprint)
Nearly one year into the COVID‑19 pandemic, the mRNA vaccines from Pfizer‑BioNTech and Moderna received emergency use authorizations in succession, marking the growing maturity of mRNA‑based therapeutics—a disruptive drug innovation platform that had remained in the shadows for many years. For a wide range of infectious diseases (including COVID‑19), rare disorders, and cancers, mRNA drugs can trigger the rapid in vivo production of diverse specific antigens or antibodies that act on corresponding cellular targets to achieve therapeutic efficacy. This has also spurred rapid development in the mRNA drug industry, with an increasing number of researchers entering this promising field.
For newcomers, however, achieving efficient in vivo delivery of mRNA—a uniquely delicate pharmaceutical agent—often poses a significant challenge. At present, drawing on earlier marketed siRNA drugs and mRNA COVID‑19 vaccines, most researchers adopt lipid nanoparticles (LNPs) to replicate the corresponding outcomes, and indeed this approach has proven highly effective. Yet there is much nuance in mRNA‑LNP systems; variations in LNP size, structure, and other parameters can affect the expression of the encapsulated mRNA. In the following sections, we will walk you through relevant studies to uncover the underlying principles.
We first focus on the impact of particle size. Early work demonstrated that modulating the PEG‑lipid content in siRNA‑LNP formulations allows the preparation of particles with different sizes [1]. Drawing on these earlier findings, researchers have varied the PEG‑lipid molar percentage from 3 mol% down to 0.25 mol% and, using a microfluidic nanoparticle preparation system, generated mRNA‑LNPs with sizes ranging from 45 nm to 135 nm, as shown in Figure 1.
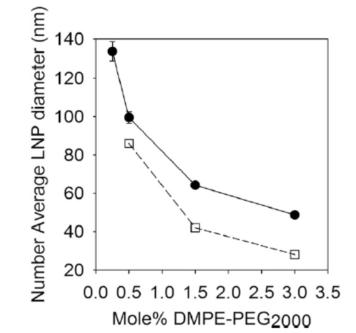
Figure 1. Particle size of mRNA‑LNPs at different PEG‑lipid contents (solid circles: mRNA‑LNPs; open circles: empty LNPs)
Subsequently, the in vitro transfection efficiency of mRNA‑LNPs with different particle sizes was examined in adipocytes and hepatocytes, with the results shown in Figure 2. In terms of cellular uptake, hepatocytes did not exhibit a size‑dependent uptake of mRNA‑LNPs, whereas in adipocytes, LNPs of 64 nm showed notably higher uptake. Uptake was found to begin almost immediately (within the first hour) and plateaued by 24 h post‑administration in adipocytes, while in hepatocytes the uptake reached a plateau more rapidly, at around 8 h. It was also observed that, in both cell types, the average cellular uptake of mRNA‑LNPs was approximately 50%.
After cellular uptake of the mRNA, protein expression was assessed using mRNA encoding human erythropoietin. During the first 8 hours, no protein expression was detected in either cell type. However, after 8 hours, LNPs of 64 nm produced significantly higher levels of human erythropoietin in both cell types compared with LNPs of other sizes. Since differences in uptake were negligible, it can be inferred that the rate‑limiting step for protein expression is the release of mRNA from endosomes (endosomal escape), a process that itself is strongly dependent on both LNP particle size and cell type.
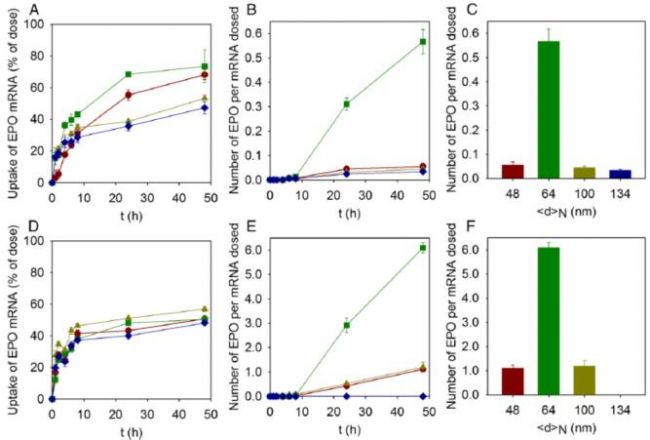
Figure 2. Cellular uptake and protein expression of LNPs of different sizes in adipocytes (A, B, C) and hepatocytes (D, E, F). Red, green, yellow, and blue data points represent LNPs of 48, 64, 100, and 134 nm, respectively.
Based on the cellular uptake and protein expression results of LNPs with various particle sizes, considering the size factor alone, mRNA‑LNPs with a particle size of approximately 60–70 nm exhibited the best performance in both cellular uptake and protein expression. However, the structure and composition of LNPs also play a critical role, and we will continue to explore this aspect in our next discussion.
Microfluidizer Nanotechnology Limited, Company number: 13114417
| 
|
 ADD:Office Suite 29A, 3/F 23 Wharf Street London ,United Kingdom,SE83GG
  WEB:www.
 EMAIL:admin@